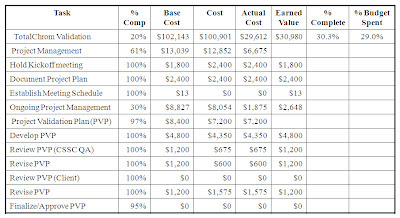
How many times do you ask this question of one of your vendors and receive an answer that you don’t believe? What percentage of the project is complete? This is a simple question that allows you to compare this figure against the percent budget spent to see how likely it is that this project will finish on budget. Your vendors will make up all sorts of reasons for you to believe their statistics that show how complete the project is. Wouldn’t you like an objective calculation that gives you this number exactly?
I have been using a simple technique that allows me to plan projects, forecast their costs and communicate their weekly status with complete accuracy. My clients are always happy with the information they receive. This is not to say my projects always come in under budget. My projects are plagued with the same uncertainties any other projects face, some causing budget overruns. The difference is that I communicate these overruns weekly, honestly, can pinpoint the causes and allow my clients to make business decisions based on them. I don’t wait until the project is 75% complete and all the money is spent to ask for more money.
There is no magic behind the technique. The federal government mandates that projects run for them use a technique known as Earned Value Project Management to report time against task. But not many laymen understand it without some intensive training in the technique. Everyone understands what it means when a project is 2 weeks behind schedule, but most would be confused if told it is $10,000 behind schedule.
It is possible, however, to salvage some of the official earned value calculations to generate two numbers that are meaningful to customers: Percentage of the project that is complete and percentage of the budget that has been spent.
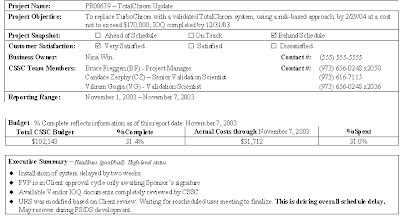
Below is an excerpt from a status report that shows these two numbers in the budget portion:
So how do I generate and then justify these numbers?
The Planning Phase
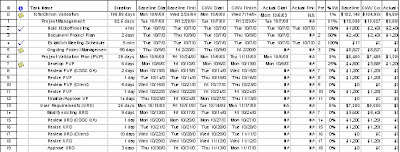
I plan each project in front of the clients, with their active participation. This makes it possible to obtain their buy-in for the tasks for which they take responsibility. From this planning activity, I can generate a Gantt chart in MS Project detailing Duration, Start and Finish, Percentage Complete, Responsibility and Percentage Time spent on each task. By filling out the hourly rates for the assigned personnel on the Resource sheet I obtain a Project Budget (in the Cost column).
Once agreement is reached between the PM and the clients on the cost for each task and the overall project cost and schedule, a few columns can be added to the project plan. Baseline Start and Finish and Actual Start and Finish.
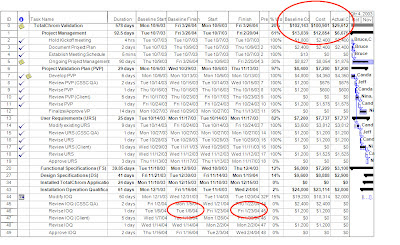
The same is done with the cost columns adding Baseline and Actual costs and renaming Cost to Current Working View (CWV) cost. The Gantt chart now looks like this:
The Implementation Phase
At each status meeting with the project team, I ask for percentage complete on each task and the number of hours spent on each task. The percentage complete is entered on the Gantt Chart, then the hours spent are multiplied by the hourly rate and this is entered into the Actual Cost column. The Actual Start and Finish dates are entered in their respective columns.
At this point, the Gantt chart is yielding some very important data for the client. Baseline End Date and CWV End Date show any schedule delay. Baseline Cost and CWV Cost show over or under budget predictions. It also shows some very poor data: percentage project complete. Experimentation with MS Project has shown that this is not correct, especially if some resources are shown as costing dollars and others are not (e.g., when a consultant shows their tasks on the same Project Schedule as the client tasks).
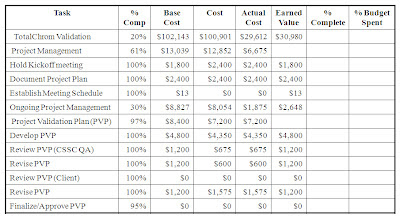
For each task, the Baseline Cost is the Value earned when it is complete. The Percentage Complete times the Baseline Cost is the Earned Value that is earned for a partially completed task.
Simply adding up all these partial earned values, and dividing them by the Baseline Project Cost can generate the Percentage Complete for the project. And by dividing the Actual Project Cost (summed by MS Project) by the Baseline Project Cost, I can determine the Percentage Budget Spent. These numbers make sense and are meaningful to a client. I use a simple Excel spreadsheet to make this calculation easier.
The two key values can be copied onto a status report: Percentage Complete and Percentage Budget Spent. The client can examine any discrepancies in these figures for the reasons behind the cost changes. The Gantt chart shows which task is coming in way above or below budget and the project manager can usually explain why this occurred.
The importance of Earned Value is that when a project using it is 15% complete, one can predict within 90% accuracy how much above or under budget it will be at completion. Any discrepancy found at 15% project completion holds through until the end of the project within 90% accuracy. This calculation has been proven by auditing thousands of government projects, small to large, using earned value calculations for decades.
It is possible to finesse these numbers to make the project look more complete than it really is. Only on partially completed tasks though. If a task is really only 10% complete and one claims it as 90% complete, an unscrupulous vendor can exaggerate project % Complete. But this will only work a couple of times and the vendor will be found out long before the project is complete. This is not a good way to run a business and these vendors will be weeded out quickly.
I encourage you to ask your vendors to use these calculations to give you meaningful weekly project status. You need to know early on how much over budget your projects are likely to be so you can budget accordingly or get rid of the inefficient vendors.
Anybody else have ideas that work well in this realm?


